Your .NET app might be bleeding performance
Your .NET app might be bleeding performance — and you won’t see it until it’s too late.
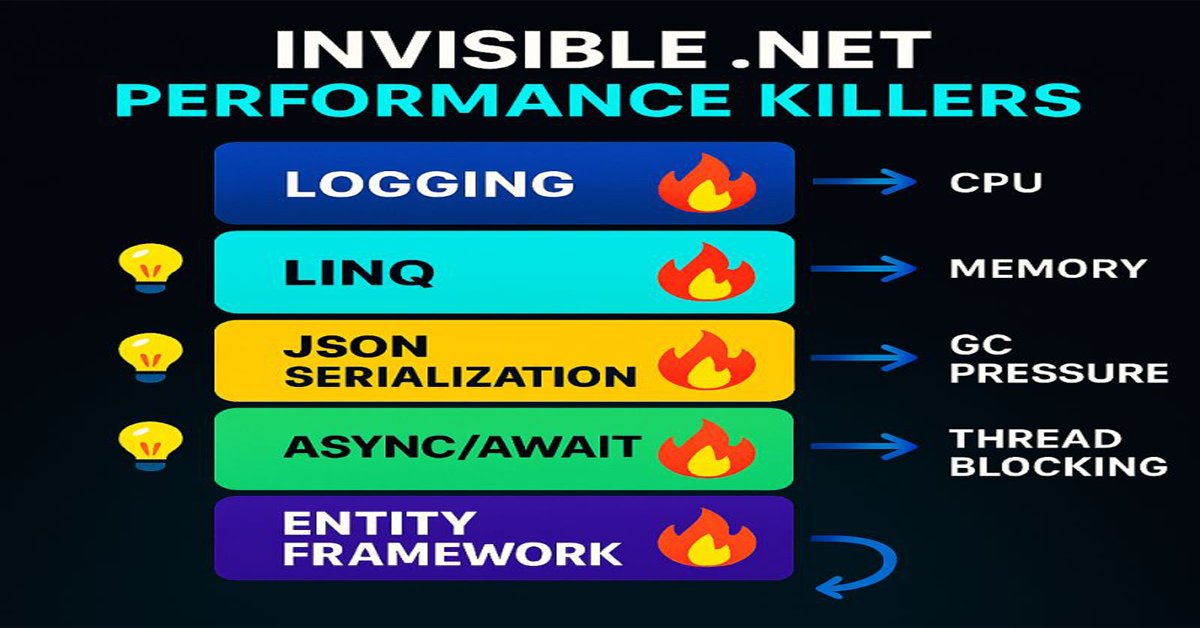
- I’ve rounded up 6 invisible .NET performance killers that silently drain CPU, memory, and throughput — plus the quick fixes that stop them in their tracks
LINQ – Silent Complexity Multiplier
- Problem: Deferred execution and intermediate enumerables create CPU & memory overhead at scale.
- Fix: Push heavy queries to SQL, use indexes, and avoid LINQ-to-Objects for massive datasets.
Async/Await – Hidden Thread Blocker
- Problem: Blocking calls (.Result, .Wait()) and excessive context switches cause thread pool starvation.
- Fix: Never block async methods, use ValueTask for high-frequency calls, profile thread pool usage.
Logging – Hidden Latency Injector
- Problem: Synchronous, verbose logs block threads and spike CPU under load.
- Fix: Use structured logging with async sinks (Serilog), log only business-critical events, separate debug vs prod logs.
Dependency Injection – Startup Slug
- Problem: Too many scoped services or reflection-heavy lifetimes slow startup and per-request resolution.
- Fix: Minimize scoped dependencies, pre-compile container graphs, modularize DI setup.
JSON Serialization – Memory Melter
- Problem: Large or deep object graphs cause massive allocations and GC pressure.
- Fix: Use streaming serialization (Utf8JsonWriter), paginate large collections, measure payload sizes.
Entity Framework – N+1 Query Nightmare
- Problem: Lazy loading and poor query design generate multiple queries, exploding database calls.
- Fix: Use .Include() for eager loading, batch load when possible, analyze EF logs for hidden queries.